Introduction
To evaluate whether participation in corporate accelerators leads to measurable signals and quantifiable performance indicators, this blog post explores two methods useful for the dissertation: linear regression analysis and analysis of variance (ANOVA). They will serve as a simplified explanation with generic examples about what these methods are and provide statistical tools to assess how accelerator participation influences startup KPIs such as funding rounds, IPO outcomes, or survival rates. Quantitative models are increasingly favoured in entrepreneurship literature for their ability to offer clarity, generalisability, and empirical precision. (Canovas-Saiz et al., 2021; Seitz et al., 2023).
This post represents a series of articles related to a research and dissertation called “Are corporate accelerators springboards for startups: a performance analysis of the Microsoft’s and Google’s accelerated.
Why Quantitative Methods for Accelerator Performance?
Qualitative case studies are insightful but lack objectivity and are limited in scalability. In contrast, quantitative methods enable researchers to:
- Clear identification of patterns and effects across large startup datasets.
- Statistical validation of causal relationships.
- Comparative analysis between different groups (e.g., startups accelerated by Microsoft vs. Google).
These techniques have already been used in articles presented in the literature review. For instance, Seitz et al. (2023) used OLS regression (ordinary least squares) to test how accelerator design affects startup performance, while Canovas-Saiz et al. (2021) applied ANOVA and logistic regression to assess survival and impact of accelerators on startups.
Linear Regression: Measuring Predictive Influence
Linear regression estimates the relationship between a dependent variable (e.g., startup performance) and one or more independent variables (e.g., accelerator participation). It is used to quantify the direction and strength of the effect or the tendency of the outcome.
When to Use It:
- When the dependent variable is continuous (e.g., total funding amount).
- To test if being in an accelerator increases a startup’s funding after participation.
Formula:
y = β0 + β1x + ε
where:
- y = Outcome of the dependent variable (e.g., funding or startup performance).
- x = Independent variable (e.g., binary variable indicating accelerator participation: 1 = Yes, 0 = No).
- β0 = Intercept (the expected value of y when x = 0).
- β1 = Coefficient that quantifies the change in y for each unit increase in x (e.g., the effect of accelerator participation)
- ε = Error (if any).
Simple Example:
Suppose we want to know if accelerator participation increases startup funding.
| Startup | Accelerator (x) | Funding in $M (y) |
|---|---|---|
| A | 1 | 4.0 |
| B | 1 | 5.5 |
| C | 0 | 1.2 |
| D | 0 | 2.1 |
Running a linear regression would estimate how much funding (on average) is gained by being in an accelerator.
In this case:
- The variable x is a binary indicator (‘1' if the startup participated in an accelerator; ‘0' otherwise).
- The regression coefficient β1 will tell us, on average, how much more (or less) funding startups that joined an accelerator received compared to those that didn’t.
- For example, if β1 = 2.5, it means participating startups raised $2.5M more than non-participants, on average.

In the above illustration, the x-axis represents accelerator participation (0 or 1), and the y-axis shows the funding amount. The regression line (in red) models the average funding difference between the two groups.
How to Use Linear Regression in Excel
- Insert your data with independent and dependent variables in two columns.
- Select
Data>Data Analysis>Regression. If it is not available, Data Analysis Toolpak may be needed to execute the command. - Define input y range (e.g., funding), and input x range (e.g., accelerator status).
- Check “Labels” and click OK.
- Excel will output coefficients, R-squared value, and p-values.
How to Use Linear Regression in Python
import pandas as pd
import statsmodels.api as sm

# Example data
data = pd.DataFrame({
    'Accelerator': [1, 1, 0, 0],
    'Funding': [4.0, 5.5, 1.2, 2.1]
})

X = sm.add_constant(data['Accelerator'])  # Add intercept term
model = sm.OLS(data['Funding'], X).fit()
print(model.summary())
The model.summary() output will show the intercept (β0), coefficient for accelerator participation (β1), and their p-values. R-squared is the proportion of variance in y explained by x. P-value is a test if the effect is statistically significant (p < 0.05).
Analysis of Variance (ANOVA): Comparing Group Means
It is used to determine if there are significant differences in the means of multiple groups. In this context, it will test whether startups from different accelerators (Google vs. Microsoft) perform differently or average performance (e.g., funding raised) differs between startups that didn't participate in an accelerator, those that joined Microsoft for Startups, and those that joined Google for Startups.
If the means (averages) of these groups are significantly different, a conclusion could be drawn that the accelerator has an effect on startup outcomes. When there is one categorical independent variable (e.g., accelerator group) and one continuous dependent variable(e.g., funding amount), ANOVA is applied to find out if the average funding values significantly differ among the three groups.
Other Concepts
What is a Categorical Factor?
A categorical factor does not represent numerical quantities, but groups or classifications . These variables are essential in statistical testing to give a definition of populations being compared.
Examples of Categorical Factors:
- Accelerator Group: Google, Microsoft, No Accelerator.
- Startup Stage: Initial Seed, Series A, Series B.
- Industry Target: SaaS, Health tech, Finance.
These categories serve as the basis for grouping startups when comparing average outcomes like funding or revenue.
What is a t-test?
It is a statistical method used to compare means of two independent groups to determine if there is considerable difference. It is ideal for simpler cases with only two groups (e.g., comparing startups in vs. out of an accelerator). However, when evaluating three or more groups, such as comparing startups from Google, Microsoft, and non-accelerated cohorts, the t-test becomes insufficient.
When to Use It:
There are several types of ANOVA:
- When comparing more than two groups.
- When the dependent variable is continuous (e.g., revenue or funding).
- The independent variable is categorical (e.g., accelerator group: Google, Microsoft, No Accelerator).
| Type | When to Use |
|---|---|
| One-Way ANOVA | One independent variable (e.g., accelerator group) |
| Two-Way ANOVA | Two independent variables (e.g., accelerator + region) |
| MANOVA | Multiple dependent variables (e.g., funding + revenue) |
Variables and Terms
- Group: Categorical variable representing the accelerator type (Google, Microsoft, or none).
- Mean: Average of the dependent variable within each group.
- F-statistic: A value that compares between-group variance to within-group variance. A higher F suggests stronger group differences.
- p-value: Probability that the group differences happened by random chance. If p < 0.05, then its result is statistically significant.
- Degrees of Freedom (df): Number of independent values used to calculate the F-statistic, based on group count and sample size.
Simple Example:
Assume testing if funding differs significantly across the three groups mentioned before. Let's present an hypothetical case:
| Group | Funding ($M) |
|---|---|
| No Accelerator | 1.0, 1.4, 1.2, 1.5, 1.3 |
| Microsoft for Startups | 3.5, 3.9, 3.6, 4.0, 4.1 |
| Google for Startups | 4.0, 4.2, 4.3, 4.1, 3.9 |
The specific form used here is One-Way ANOVA, because it involves one categorical factor (accelerator group) and tests its effect on one continuous variable (e.g., funding).
For this example, one-way ANOVA is used because:
- One independent variable: Group (3 levels: No Accelerator, Microsoft, Google).
- One dependent variable: Funding ($M).
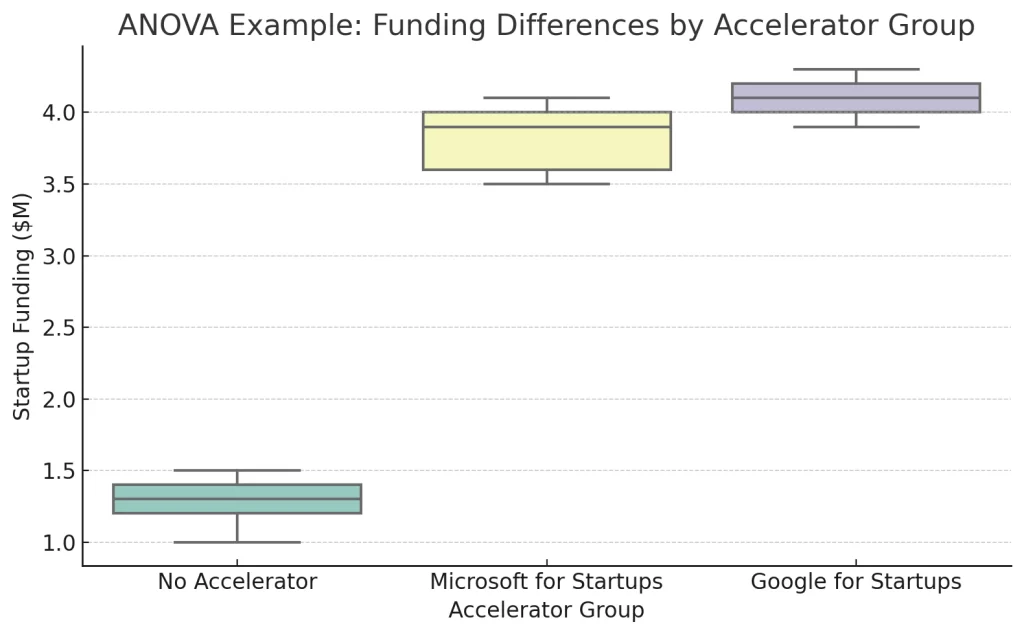
There is strong statistical evidence that startups in different accelerator programs raise significantly different levels of funding. The differences between the average funding in the three groups (No Accelerator, Microsoft, and Google) are not random.
This result provides a foundation for applying ANOVA in the real dataset later in the dissertation (Chapter 4), where the method will be used to compare actual outcomes for Google-accelerated, Microsoft-accelerated, and non-accelerated startups.
How to Use ANOVA in Excel
- Go to
Data>Data Analysis>ANOVA: Single Factor. - Input the data range (must be organized by column for each group).
- Click OK.
- Excel outputs F-statistic, p-value, group means, and degrees of freedom.
Look for the p-value. If it’s below 0.05, group differences are statistically significant.
How to Run ANOVA in Python
Using the scipy.stats package:
from scipy.stats import f_oneway

# Example groups
no_accel = [1.0, 1.4, 1.2, 1.5, 1.3]
microsoft = [3.5, 3.9, 3.6, 4.0, 4.1]
google = [4.0, 4.2, 4.3, 4.1, 3.9]

f_stat, p_value = f_oneway(google, microsoft, no_accel)
print("F-statistic:", f_stat)
print("p-value:", p_value)
The printed p-value will guide your interpretation. If p < 0.05, the differences between accelerator programs are statistically significant.
Advantages of Using Both Methods
| Method | Use Case | Benefit |
| Linear Regression | Predicting performance based on variables | Estimates size and direction of impact |
| ANOVA | Comparing average outcomes across groups | Tests statistical significance of differences |
By combining both approaches, this study can:
- Identify whether differences in startup performance exist (via ANOVA),
- Quantify how much of that difference is attributable to accelerator participation (via regression).
Limitations
- Linear regression assumes a linear relationship and normal distribution of residuals.
- ANOVA assumes homogeneity of variances across groups.
- Neither method can fully eliminate selection bias (e.g., accelerators selecting high-potential startups).
- Regression may require additional control variables (e.g., industry, geography) to improve accuracy or separation in further segmented analysis.
Conclusion
Quantitative methods such as ANOVA and linear regression offer robust tools to evaluate the impact of corporate accelerators on startup success. By applying both, this dissertation will test whether participation in Microsoft’s or Google’s programs significantly influences post-acceleration outcomes. These models will be applied in Chapter 4 using the dataset of startups that passed through each program.
References
- Canovas-Saiz, D., Martínez-Sánchez, Á., & Andreu-Andrés, M.Á. (2021). Incubators vs. Accelerators: A survival analysis of new ventures. Journal of Business Research, 125, 371–379. https://doi.org/10.1016/j.jbusres.2020.12.039
- Seitz, N., Krieger, B., Mauer, R., & Brettel, M. (2023). Corporate accelerators: Design and startup performance. Small Business Economics. https://doi.org/10.1007/s11187-023-00732-y
- Wikipedia contributors. (n.d.). Linear regression. Wikipedia. Retrieved from https://en.wikipedia.org/wiki/Linear_regression
- Wikipedia contributors. (n.d.). Analysis of variance. Wikipedia. Retrieved from https://en.wikipedia.org/wiki/Analysis_of_variance
[…] methodology and justification for using ANOVA are described in Section 2.7: Quantitative Methods for Accelerator Performance. Here, results will be merely expressed, while in Section 4.5 an interpretation and context will […]