This section presents a lineal regression analysis for corporate accelerator performance, focusing on funding outcomes (i.e. measurable results) in the period of 3 years for startups accelerated by Google and Microsoft. Additionally, an evaluation is done to check if there is any correlation between corporate accelerators (statistically speaking). The goal is to assess how funding trajectories evolve over time within each program and when compared head-to-head, thereby helping us evaluate whether corporate accelerators serve as springboards or sand traps for startup growth. All regression models are based on data sourced from Crunchbase and have been structured into a cleaned, normalised database for statistical testing.
Linear regression models across five time periods regarding funding and its involvement with the acceleration program:
- Before Acceleration: Funding recorded before joining the accelerator program, if any.
- At Acceleration Date: Funding received on the official date of acceleration, if any.
- Year 1: Funding raised during the first year post-acceleration, if any.
- Year 2: Funding raised during the second year post-acceleration, if any.
- Year 3: Funding raised during the third year post-acceleration, if any.
The methodology and justification for using lineal regression are described in Section 2.7: Quantitative Methods for Accelerator Performance. Here, results will be merely expressed, while in Section 4.5 an interpretation and context will be given.
This post represents a series of articles related to a research and dissertation called “Are corporate accelerators springboards for startups: a performance analysis of the Microsoft’s and Google’s accelerated.
Methodology
The linear regression models use cumulative funding (in millions of USD) as the dependent variable. On the other hand, accelerator program (Google or Microsoft) and periods of time are used as independent variables. These modelling strategies were applied:
- Google-only regression: Examines the trend of funding over time within Google-accelerated startups.
- Microsoft-only regression: Assesses the same trend within Microsoft-accelerated startups.
- Google and Microsoft Combined Model: An overall view of its performance.
- Interaction model (Google × Time): Tests whether the funding slopes over time differ significantly between Google and Microsoft.
Google-only Regression
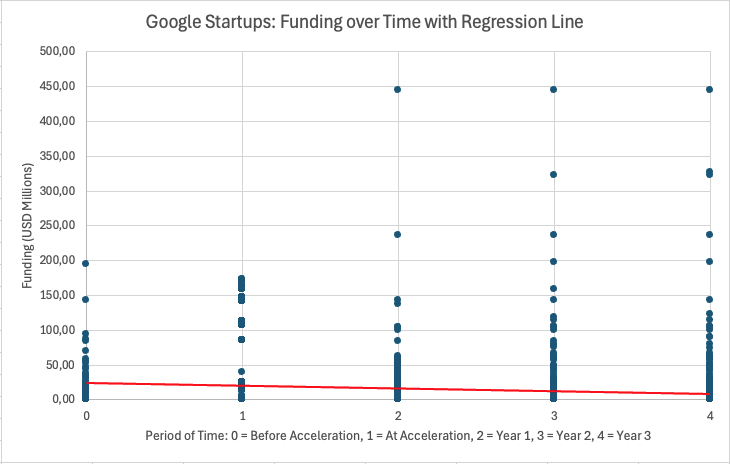
It included 617 startups across five periods. Scatter plots and regression line (in green) illustrate the distribution of funding data points alongside the model’s prediction. Startups with zero funding were also included. The regression estimates the intercept (funding at Before Acceleration) and the slope (average change in funding per period).
| Period | Fitted Value on Y-Axis (USD million) |
|---|---|
| Before Acceleration | 24.24 |
| At Acceleration | 20.40 |
| Year 1 | 16.56 |
| Year 2 | 12.72 |
| Year 3 | 8.88 |
| Metric | Value |
|---|---|
| Slope | -3,84 million USD per period |
| P-value | <0.001 |
| R² | 0.017 |
The negative slope indicates a decline of ~3.84 million USD in average funding across periods, indicating that funding declines as time passes by. Despite the highly significant p-value, the R² is only 0.017, meaning the model explains just 1.7% of the variance, suggesting that other factors (e.g., industry, geography, prior funding) play a major role in funding outcomes. The p-value indicates that it is statistically significant.
Microsoft-only Regression
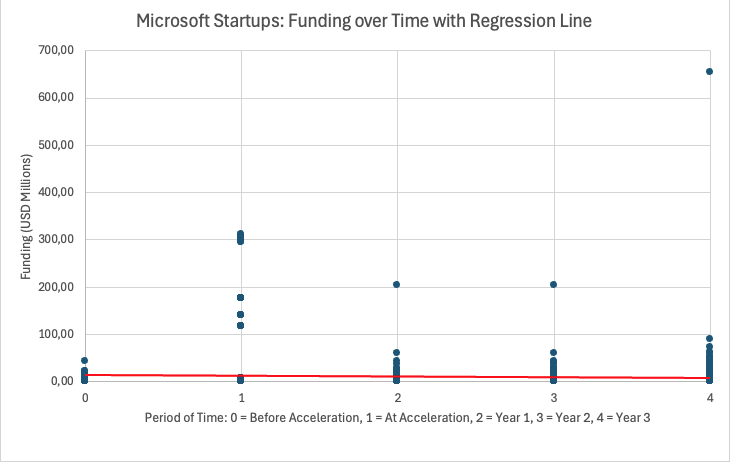
The Microsoft-only regression included 238 startups. Similar to the modelling approach done with Google, scatter plots and regression line (in green) illustrate the distribution of funding data points alongside the model’s prediction. As expected, startups with zero funding were also included.
| Period | Fitted Value on Y-Axis (USD million) |
|---|---|
| Before Acceleration | 8.21 |
| At Acceleration | 12.57 |
| Year 1 | 16.93 |
| Year 2 | 21.29 |
| Year 3 | 25.65 |
| Metric | Value |
|---|---|
| Slope | +4.36 million USD per period |
| P-value | 0.014 |
| R² | 0.037 |
Microsoft startups exhibited an upward slope (slightly), but statistically significant trend in cumulative funding across periods. The slope of +$4.36M per period indicates modest growth over time. While statistically valid (p = 0.014), the low R² means that time alone explains little of the funding variability, indicating that other factors (such as sector, market conditions, or startup maturity) play larger roles.
Google and Microsoft Combined Model
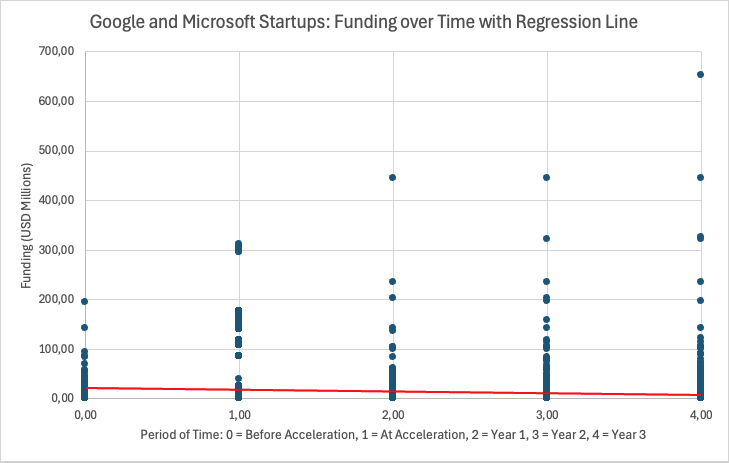
This part of the regression analysis broadens the scope to simultaneously evaluate the performance of all 855 startups, combining the Google and Microsoft cohorts into a unified analytical model. The objective is to determine whether, when placed side by side, these two corporate accelerators show similar or diverging funding trajectories over time, and whether the accelerator program itself explains variance in funding outcomes.
| Period | Fitted Value (USD million) |
| Before Acceleration | 21.78 |
| At Acceleration | 18.46 |
| Year 1 | 15.14 |
| Year 2 | 11.82 |
| Year 3 | 8.50 |
| Metric | Value |
|---|---|
| Slope | +4.36 million USD per period |
| P-value | <0.001 |
| R² | 0.012 |
Combining both startup accelerators indicates that funding goes downward after the program, although it is important to understand that it indicates cumulative, until-that-date funding. The p-value indicates that it is statistically significant.
Interaction Term: Google × Time
Here, we also introduce an interaction term to test whether funding trajectories over time differ significantly between Google and Microsoft.
The interaction term assessed whether the time slopes differed between programs. A positive and significant coefficient for Google × Time would indicate that Google’s funding trajectory steepens faster over time compared to Microsoft. This component enriched the model by showing whether Google’s lead is sustained, widens, or shrinks over time.
| Metric | Value |
| Intercept | 24.24 million USD |
| Period Slope | –3.84 million USD |
| Accelerator Effect | –8.84 million USD |
| Interaction Effect | +1.85 million USD (Google vs Microsoft difference over time) |
| P-value | 0.07 |
| R² | 0.016 |
Summary
This regression analysis for corporate accelerator performance has measured funding within each program and made a series of measures to them. Google-accelerated startups showed significantly higher funding before and at the time of acceleration. However, differences in post-program performance (Years 1 to 3) were statistically negligible, suggesting convergence over time.
While the results reveal some notable differences, particularly in early-stage funding (before and at acceleration), deeper discussion of what this means will be held in Section 4.5: Interpretation of Findings.
The table below summarizes the key slopes, p-values, and their interpretations across all models:
| Analysis Type | Slope (per period) | p-value | R² | Interpretation |
|---|---|---|---|---|
| Google-only | –3.84 | <0.001 | 0.017 | Funding trend within Google over five periods |
| Microsoft-only | +4.36 | 0.014 | 0.037 | Funding trend within Microsoft over five periods |
| Google and Microsoft | –3.32 | <0.001 | 0.012 | Average funding difference between programs |
| Interaction term (Google × Time) | +1.85 (interaction effect) | 0.07 | 0.016 | Whether Google’s time trend differs from Microsoft |
The next section (4.4) will complement this funding-based view with binary outcome metrics (e.g., IPO, closure) for a more complete performance evaluation.
References
- Crunchbase. (n.d.). Crunchbase: Discover innovative companies and the people behind them. Retrieved from https://www.crunchbase.com/
- Seitz, N., Krieger, B., Mauer, R., & Brettel, M. (2023). Corporate accelerators: Design and startup performance. Small Business Economics. https://doi.org/10.1007/s11187-023-00732-y
- Wikipedia contributors. (n.d.). Linear regression. Wikipedia. https://en.wikipedia.org/wiki/Linear_regression