Before evaluating whether corporate accelerators act as springboards or sand traps for startup performance, it is important to explore the structure and distribution of the database itself. This section presents key descriptive statistics that profile the 855 startups from Google and Microsoft accelerators included in the analysis, drawing on data extracted from Crunchbase and structured specifically for this dissertation.
The goal is to set in context many statistics of country distribution, industrial sector classification (companies’ SIC codes), variations among acceleration programs and funding characteristics prior applying ANOVA and regression models and testing the previous hypothesis.
This post represents a series of articles related to a research and dissertation called “Are corporate accelerators springboards for startups: a performance analysis of the Microsoft’s and Google’s accelerated.
COuntry DISTRIBUTION
The database gathered from Crunchbase contains a total of 855 startups. Of these:
- 170 startups (19.9%) are based in the United States of America.
- 685 startups (80.1%) are based outside of the United States of America.
It reflects an international presence on the reach and influence of Google and Microsoft accelerator programs.
PROGRAM-SPECIFIC VARIATIONS
The startups in the database were accelerated through different editions of the Google and Microsoft programs:
- Google managed:
- Google for Startups
- Google Launchpad Accelerator
- Microsoft managed:
- Microsoft Accelerator
- Microsoft Accelerator Bangalore
- Microsoft Accelerator Beijing
- Microsoft Accelerator Berlin
- Microsoft Accelerator London
- Microsoft Accelerator Paris
- Microsoft Accelerator Seattle
- Microsoft ScaleUp Tel Aviv
These program variations reflect the geographical and strategic diversity of each accelerator, offering localised support and specialised resources depending on region and target industry.
INDUSTRY DISTRIBUTION (SIC CODES)
SIC stands for Standard Industrial Classification, a nomenclature system used to categorise industries into four digits. However, for the dissertation we just require three since it is required less specificity.
Both Google and Microsoft accelerator programs have 72 unique SIC codes (from the accelerated startups), reflecting a wide variety of industry sectors. The 10 most common SIC codes from the group are, with their associated descriptions:
- 737 – Computer Programming, Data Processing, and Other Computer Related Services
- 878 – Business Services, Not Elsewhere Classified
- 616 – Mortgage Bankers and Loan Correspondents
- 828 – Schools and Educational Services, Not Elsewhere Classified
- 474 – Rental Services, Not Elsewhere Classified
- 727 – Computer Rental and Leasing
- 808 – Home Health Care Services
- 515 – Wholesale Trade – Farm-product Raw Materials
- 585 – Retail – Consumer Electronics Stores
- 595 – Retail – Hobby, Toy, and Game Shops
These figures show a strong presence of tech, fintech, education, and retail-related innovations among accelerated startups. The frequency distribution shows that digital and innovation-driven sectors dominate the database, reflecting the technological priorities of both accelerator programs.
FUNDING STATISTICS
All funding amounts were normalized to millions of U.S. dollars. The table below summarizes funding statistics across four time periods:
At Acceleration (Year 0):
- Startups funded: 280
- Not funded: 575
- Median: $0.05M
- Mean: $2.91M
- Max: $205.89M
1 Year After Acceleration (Year 1):
- Startups funded: 301
- Not funded: 554
- Median: $0.23M
- Mean: $5.01M
- Max: $444.50M
2 Years After Acceleration (Year 2):
- Startups funded: 235
- Not funded: 620
- Median: $0.18M
- Mean: $3.80M
- Max: $240.00M
3 Years After Acceleration (Year 3):
- Startups funded: 191
- Not funded: 664
- Median: $0.14M
- Mean: $3.61M
- Max: $240.00M
These numbers reveal that most startups received modest early-stage funding, with a few notable outliers that raised significant capital. It is important to note that not all funding raised at the time of acceleration came directly from the accelerator. Many startups entered the program with pre-existing capital, sourced from angel investors, seed rounds, or venture capital.
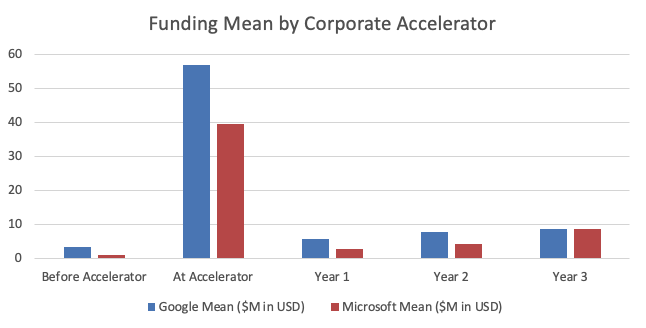
Group Funding Means
| Time Period | Google Avg ($M) | Microsoft Avg ($M) |
|---|---|---|
| Before Acceleration | 3.49 | 1.11 |
| At Acceleration | 56.89 | 39.76 |
| Year 1 | 5.78 | 3.00 |
| Year 2 | 7.86 | 4.46 |
| Year 3 | 8.86 | 8.83 |
Graphical Representation
A bar chart is represented below to visualise average funding across the five periods for both accelerators. This helps highlight divergence, convergence, or parity over time.
TIMING AND STARTUP MATURITY
Founding and acceleration years provide insights into the lifecycle stage of startups entering these programs:
- Earliest founding year: 2014
- Earliest acceleration date: 2014
- Shortest time from founding to acceleration: 0 years (same year)
- Longest time from founding to acceleration: 9 years
- Most common founding year: 2014
- Most recent founding year: 2017
- Most common acceleration year: 2016
- Most recent acceleration year: 2023
These figures suggest that both newly founded and relatively (pre)mature startups participated in corporate accelerators, although the majority fall within the 2–6 year window post-founding; in fact, 532 startups or 62% of them were accelerated in this window period. These indicators reflect the startup lifecycle stage at which the accelerators engaged the companies. Some had received funding before entering the program, while others raised capital only afterward.
Before any result or analysis in given, let’s first start calculating an average of the 855 startups, divided by corporate acceleration.
SUMMARY
The descriptive statistics presented in this section provide foundational insight into the nature of accelerator startups, gathered for this database. They confirm certain diversity of industry, international coverage, and range of funding. These characteristics shape the expectations for how accelerators might influence performance and help frame the hypotheses tested in subsequent sections.
References
- Crunchbase. (n.d.). Crunchbase: Discover innovative companies and the people behind them. Retrieved from https://www.crunchbase.com/
- Seitz, N., Krieger, B., Mauer, R., & Brettel, M. (2023). Corporate accelerators: Design and startup performance. Small Business Economics. https://doi.org/10.1007/s11187-023-00732-y
- U.S. Department of Labor. (n.d.). Standard Industrial Classification (SIC) System Search. Retrieved from https://www.osha.gov/data/sic-search