This section presents the ANOVA Analysis for corporate accelerator performance, comparing the funding and investment into startups accelerated by Google and Microsoft, as a measure of growth, and whether internal growth within each program evolves over time. The objective is to determine, statistically by ANOVA analysis, whether there are significant or relevant differences in startup funding performance across five distinct periods of time:
- Before Acceleration: Funding recorded before joining the accelerator program, if any.
- At Acceleration Date: Funding received on the official date of acceleration, if any.
- Year 1: Funding raised during the first year post-acceleration, if any.
- Year 2: Funding raised during the second year post-acceleration, if any.
- Year 3: Funding raised during the third year post-acceleration, if any.
The methodology and justification for using ANOVA are described in Section 2.7: Quantitative Methods for Accelerator Performance. Here, results will be merely expressed, while in Section 4.5 an interpretation and context will be given.
This post represents a series of articles related to a research and dissertation called “Are corporate accelerators springboards for startups: a performance analysis of the Microsoft’s and Google’s accelerated.
Methodology and Variables for the ANOVA Analysis for corporate accelerator performance
To conduct the analysis, the following variables are used:
Dependent Variable:
Total funding (in millions of USD) for each of the five time periods. Sourced from Crunchbase database, being structured and normalised for statistical consistency
Independent Variable:
Participation choose by the startup, either Google or Microsoft accelerator programs
Statistical Method:
A one-way ANOVA test was used to evaluate whether the difference in mean funding values between the two accelerator groups was statistically significant at each period of time head to head. The test returns two values:
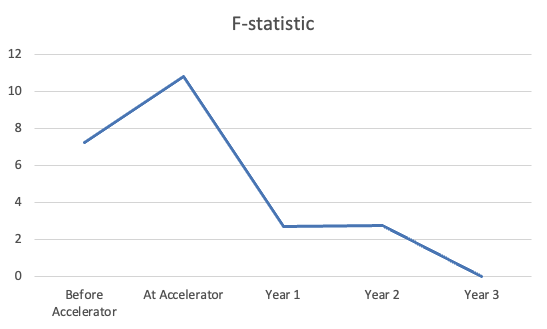
- F-statistic: Measures the ratio of variance between groups to variance within groups.
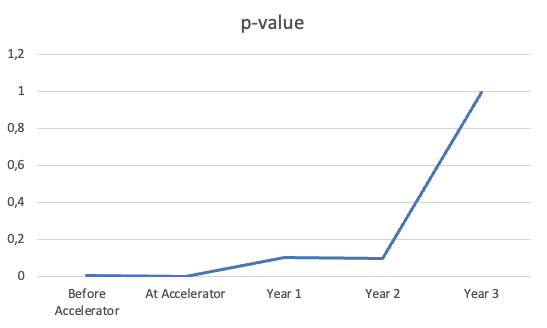
- p-value: Indicates whether the difference in means is statistically significant (threshold: p < 0.05).
Execution of ANOVA Analysis for corporate accelerator performance
| Time Period | F-statistic | p-value | Statistically Significant? |
|---|---|---|---|
| Before Acceleration | 7.27 | 0.0071 | Yes |
| At Acceleration | 10.81 | 0.0011 | Yes |
| Year 1 | 2.70 | 0.1005 | No |
| Year 2 | 2.76 | 0.0973 | No |
| Year 3 | 0.00 | 0.9913 | No |
The ANOVA Analysis for corporate accelerator performance highlights statistically significant differences in funding between Google and Microsoft programs only during the pre-acceleration and acceleration entry periods.
Graphical Representation
The chart below illustrates the average funding trends across all five periods for both accelerator programs, supporting the results from the ANOVA Analysis for corporate accelerator performance.
Summary
This ANOVA Analysis for corporate accelerator performance has revealed that funding differences between Google and Microsoft startups were significant before joining the program and at the moment of acceleration. However, in the years following participation (Year 1 to Year 3), the average funding levels between the two groups converge and no longer show significant divergence.
All interpretations and strategic implications of these results will be discussed in Section 4.5: Interpretation of Findings.
References
- Crunchbase. (n.d.). Crunchbase: Discover innovative companies and the people behind them. Retrieved from https://www.crunchbase.com/
- Seitz, N., Krieger, B., Mauer, R., & Brettel, M. (2023). Corporate accelerators: Design and startup performance. Small Business Economics. https://doi.org/10.1007/s11187-023-00732-y
- Wikipedia contributors. (n.d.). Analysis of variance. Wikipedia. https://en.wikipedia.org/wiki/Analysis_of_variance